
To turn your time-tracking data into valuable insights, start by organizing and categorizing your activities, then identify key metrics like peak productivity times and common interruptions. Use clear visualizations like charts to reveal patterns and bottlenecks. Segment data by roles or tasks for deeper understanding and set measurable goals to improve efficiency. Continuously monitor progress and adjust strategies as needed. Exploring these steps further can help you master effective workflow optimization.
Key Takeaways
- Collect and organize time-tracking data to identify activity patterns and segment by task types and demographics.
- Analyze key metrics like task duration, interruptions, and workload distribution to identify inefficiencies.
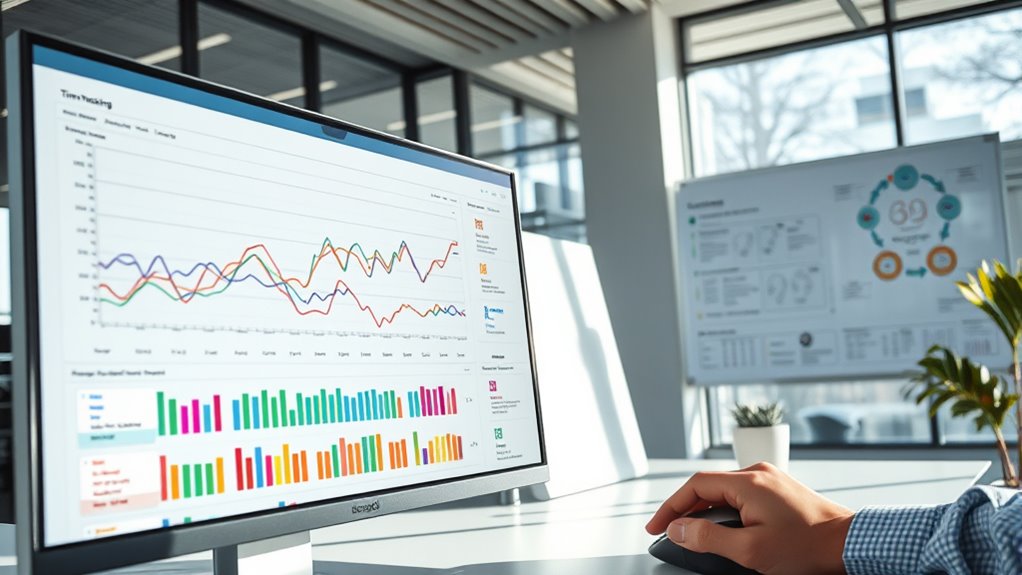
- Use visualizations such as bar and line charts to highlight trends and support decision-making.
- Automate data collection and monitoring to ensure continuous insight and timely adjustments.
- Set measurable goals based on data insights to optimize workflows and improve time management.
Gathering and Organizing Your Time-Tracking Data

To effectively analyze your time, you need to start by gathering and organizing your data carefully. Begin by collecting all your time-tracking entries, whether from apps, spreadsheets, or paper logs. Make sure your data covers a representative period—ideally, a week or two—to capture typical patterns. Next, categorize your activities into meaningful groups like work, leisure, and breaks. This step helps you see where your time is allocated. This process can also help identify patterns of activity that might not be immediately obvious. Clean your data by removing duplicates or entries that are unclear. Organize everything into a clear structure—such as a spreadsheet or tracker—so you can easily review and analyze it later. The goal is to create a thorough, accurate record that provides a solid foundation for meaningful insights. Incorporating categorization techniques can further improve the accuracy of your data.
Identifying Key Metrics and Patterns

As you review your organized time-tracking data, focus on identifying the key metrics that reveal how you actually spend your time. Look for patterns that highlight your most and least productive periods, such as peak focus hours or frequent interruptions. Pinpoint activities that take up disproportionate amounts of time, so you can evaluate their importance. Consider these four critical metrics:
- Time spent on high-priority tasks versus low-priority ones
- Duration of uninterrupted work sessions
- Frequency and length of breaks
- Time allocated to different categories like meetings, emails, or deep work
These metrics help you understand your habits and uncover opportunities for better time management. Recognizing these patterns offers clarity and guides informed adjustments to improve productivity. Additionally, understanding how your car tuning habits impact your overall efficiency can provide valuable insights into optimizing your daily routines.
Utilizing Visualization Techniques for Clarity

Using visualization techniques helps you see your time data more clearly and identify patterns quickly. Effective data presentation makes complex information understandable at a glance. By enhancing visual clarity, you can make better decisions based on your time-tracking insights.
Visual Clarity Enhancement
Enhancing visual clarity in time-tracking analysis involves applying effective visualization techniques that make data easily interpretable. To achieve this, focus on these key strategies:
- Use consistent color schemes to distinguish categories clearly.
- Simplify charts by removing unnecessary details that distract from core insights.
- Prioritize clarity over complexity—avoid cluttered visuals.
- Incorporate labels and annotations for quick understanding at a glance.
- Consider the contrast ratio of your visuals to ensure that details stand out appropriately and are easily discernible. Additionally, selecting appropriate visualization types can greatly enhance the interpretability of your data, making it easier for viewers to grasp key insights quickly. Understanding how AI analytics tools can identify patterns in data can further improve the effectiveness of your visualizations. Being aware of sleep strategies for different age groups can help tailor visualizations to specific audiences.
Effective Data Presentation
Effective data presentation hinges on selecting visualization techniques that clearly communicate your insights. You want your audience to grasp the story behind the data quickly, so choose charts and graphs that highlight key trends and comparisons. Use bar charts for categorical data, line graphs for progress over time, and pie charts for proportions, but avoid clutter. Color coding can emphasize important points, while labels and annotations add clarity. Keep visuals simple and avoid unnecessary decoration that distracts from the main message. Testing your visuals with others ensures they interpret them correctly and provides valuable feedback for improvement. The goal is to make complex data accessible and actionable, so focus on clarity and precision. Well-designed visuals turn raw data into compelling stories that inform smarter decisions. Incorporating visualization techniques based on best practices can significantly enhance understanding and retention of the information presented. Additionally, leveraging key features of effective apps, such as customization and analytics, can further improve how your data communicates insights. Recognizing the importance of regional legal resources can also help tailor your data presentation to specific audiences or locations, making the insights more relevant and impactful. Utilizing sound healing science principles can also inspire innovative ways to visualize data through rhythm and frequency patterns, engaging viewers on a deeper level.
Segmenting Data for Deeper Insights

To gain better insights from your data, you should start by categorizing work types accurately. Applying demographic filters can reveal trends across different groups, while identifying usage patterns helps optimize your workflows. Combining these approaches allows you to make more informed decisions and improve overall productivity. Incorporating creative ideas such as exfoliation benefits can also inspire engaging and memorable displays that resonate with your audience.
Categorizing Work Types Effectively
Categorizing work types accurately is essential for gaining meaningful insights from time-tracking data. When you assign activities to clear categories, you reveal patterns that inform better decision-making. To do this effectively, consider these key points:
- Define distinct categories aligned with your goals, like meetings, focused work, or administrative tasks.
- Use consistent naming conventions to avoid confusion and ensure data accuracy.
- Break down broad categories into subtypes for granular analysis, such as client meetings versus internal discussions.
- Regularly review and update categories to reflect evolving work practices, maintaining relevance and precision.
- Incorporate organization and decluttering principles to keep your categories streamlined and manageable, which enhances overall topical authority and ensures your data remains relevant and actionable. Additionally, aligning categories with privacy policies helps maintain transparency and compliance in your data management.
Applying Demographic Filters
Applying demographic filters allows you to segment your time-tracking data based on key characteristics such as role, department, location, or team. This segmentation helps you identify patterns and differences across various groups, giving you a clearer picture of how specific segments allocate their time. For example, filtering by department can reveal whether certain teams are spending more time on administrative tasks or client work. Filtering by location might highlight regional differences in productivity or workload. Demographic filters enable you to compare behaviors across different groups, uncovering insights that might be hidden in aggregated data. Additionally, by integrating emerging technologies, organizations can automate and enhance the accuracy of their data analysis processes. Incorporating personalization into your analysis can further tailor insights to specific organizational needs. Understanding work habits within different segments can help organizations develop targeted strategies for improvement. By applying these filters, you can make targeted improvements, optimize resource allocation, and better understand how your organization’s structure influences work habits. Leveraging heat pump efficiency ratings can also guide organizations in adopting sustainable and cost-effective practices.
Identifying Usage Patterns
Analyzing your time-tracking data by identifying usage patterns allows you to uncover meaningful insights about how different tasks and activities are distributed across your team. By segmenting data, you can spot trends that reveal where time is spent most effectively or wasted. This helps you optimize workflows and allocate resources better. To deepen your understanding, consider these key points:
- Peak activity times – identify when your team is most productive.
- Task frequency – see which activities recur most often.
- Duration trends – recognize tasks that take longer than expected.
- Team member contributions – compare individual time allocation for balanced workloads. Understanding performance metrics can further inform your adjustments. Incorporating insights into productivity tools can streamline your workflow management and enhance overall efficiency.
Additionally, understanding the importance of sleep and mindfulness practices can contribute to improved focus and productivity, ultimately enhancing your team’s overall performance. Recognizing the role of user engagement in content discoverability can also guide your strategies for better resource allocation. These insights enable targeted improvements and smarter decision-making.
Recognizing Inefficiencies and Bottlenecks
To identify inefficiencies and bottlenecks in your time-tracking data, you need to look for patterns where tasks take longer than expected or workflows slow down unexpectedly. Pay attention to tasks that consistently exceed their estimated durations, as these highlight areas needing process improvements. Notice points where multiple tasks pile up or where progression between activities cause delays. Look for recurring pauses or idle times that disrupt flow. Comparing data across projects helps reveal common problem areas. Recognizing these signs allows you to pinpoint specific steps causing delays or overuse of resources. By understanding where inefficiencies occur, you can focus your efforts on streamlining processes and reallocating resources effectively, ultimately improving productivity and reducing wasted time. Additionally, understanding the typical plant watering techniques can help optimize task scheduling, ensuring that routine maintenance like watering does not interfere with more critical workflows. Incorporating emergency preparedness essentials into your workflow analysis can also help anticipate and mitigate disruptions during unforeseen events. Moreover, examining tuning modifications in vehicle workflows can provide insights into optimizing maintenance schedules and resource allocation. Being aware of break times and their optimal placement within schedules can further enhance overall efficiency.
Setting Goals Based on Data-Driven Findings

Once you’ve identified inefficiencies and bottlenecks in your time-tracking data, the next step is to set clear, measurable goals that target these specific issues. Goals should be specific, actionable, and aligned with your overall productivity objectives. To guarantee effectiveness, consider these key points: 1. Define precise targets to eliminate or reduce identified bottlenecks. 2. Set realistic deadlines to foster accountability. 3. Use quantifiable metrics to track progress over time. 4. Break larger goals into smaller, manageable tasks for steady improvement. Additionally, understanding grocery savings strategies can inform your approach to optimizing workflows and resource allocation.
Implementing Changes and Monitoring Progress

After setting clear goals, the next step is to implement targeted changes and actively monitor their impact. Begin by making specific adjustments based on your data insights, such as reallocating time to high-priority tasks or reducing time spent on distractions. As you implement these changes, track your progress regularly—whether daily or weekly—to see how they influence your productivity. Stay attentive to patterns or setbacks, and be ready to refine your approach if needed. Consistent monitoring helps you understand whether your modifications are effective or require further tweaks. Remember, this process isn’t a one-time effort; ongoing observation guarantees you stay aligned with your goals and continually improve your time management strategies.
Leveraging Tools and Software for Automated Analysis

Leveraging tools and software for automated analysis can substantially enhance your ability to track and interpret your time management data. These tools save time, reduce manual effort, and provide real-time insights to optimize your productivity. With the right software, you can identify patterns, detect inefficiencies, and make data-driven decisions effortlessly.
Automated tools streamline data analysis, revealing patterns and boosting productivity effortlessly.
Consider these key benefits:
- Automate data collection, minimizing errors and saving hours.
- Visualize your data with charts and dashboards for quick understanding.
- Set alerts for deviations, helping you stay on track.
- Generate reports automatically, enabling ongoing improvement.
Frequently Asked Questions
How Can I Ensure the Accuracy of My Time-Tracking Data?
To guarantee your time-tracking data is accurate, start by choosing a reliable system that fits your workflow. Be consistent with how and when you log your hours, avoiding delays or guesswork. Regularly review your entries for errors or inconsistencies, and make adjustments as needed. Also, set reminders to prompt timely updates. By staying disciplined and vigilant, you’ll improve the precision of your data and gain better insights.
What Are Common Pitfalls in Interpreting Time Data?
When interpreting time data, you might fall into common pitfalls like assuming correlation equals causation or ignoring context. You could also overlook outliers or misinterpret busy periods as inefficient, leading to false conclusions. To avoid this, analyze patterns carefully, consider external factors, and compare data over time. Remember, numbers alone don’t tell the full story; always ask what’s driving the trends before making decisions.
How Often Should I Review or Update My Time Analysis?
Did you know that 60% of successful businesses review their time data weekly? You should update your time analysis at least once a week to stay accurate and identify trends early. Regular reviews help you catch inefficiencies, adjust priorities, and improve productivity. Don’t wait too long—monthly updates are too infrequent for most needs. Consistent, timely analysis keeps your workflow optimized and insights fresh.
Can Time-Tracking Data Predict Future Project Timelines?
You’re wondering if your time-tracking data can predict future project timelines. While it offers valuable insights into past performance, it doesn’t guarantee precise predictions. However, analyzing trends can help you identify potential delays or bottlenecks. By regularly reviewing your data, you can make more informed estimates, adjust your plans proactively, and improve project accuracy over time. Use historical data as a guide, but stay flexible for unforeseen changes.
How Do I Handle Missing or Inconsistent Data Entries?
When you encounter missing or inconsistent data entries, start by identifying the gaps or errors. You can fill missing data with averages, medians, or use interpolation methods. For inconsistencies, verify with team members or logs, and standardize data formats. Regularly audit your data to catch issues early, and implement validation rules to prevent future inconsistencies. This approach guarantees your analysis remains accurate and reliable.
Conclusion
By harnessing your data with diligence and dedication, you turn numbers into nuanced insights. Focus on finding flaws, fueling your focus, and forging forward with fresh focus. Remember, consistent collection, clear comprehension, and conscious changes create lasting progress. Stay sharp, streamline your strategies, and see success steadily soar. Your data-driven decisions don’t just demonstrate dedication—they drive dynamic development, delivering deliverables with purpose and precision.